
An explorationist’s goal is a balance between recommending opportunities, at the same time as quantifying risk. Making high-stakes investment decisions requires reliable tools and accurate, high-quality data. One of the most effective methods for guiding these choices is sweet spotting.
Sweet spotting is a method to locate the most prospective areas within a basin or play fairway. It focuses on identifying where the probability of hydrocarbon presence and commercial success is highest. This multi-scale, integrative process is an effective tool to guide exploration from basin screening to well placement. By systematically identifying areas where geological conditions align most favourably, more informed investment decisions can be made.
What Are Sweet Spots?
A sweet spot represents spatial area and stratigraphic zones where critical petroleum systems elements (PSE) converge. These elements include;
- Source rock presence and maturity
- Reservoir quality and distribution
- Seal effectiveness
- Trap geometry and integrity
- Hydrocarbon charge
- Migration timing
Sweet spotting operates across multiple scales, refining and improving as the process converges on an optimal geological target. Regional screening is first undertaken to define broad trends controlled by tectonics and basin evolution. Then it moves to the lead scale, where subsurface data is integrated and analysed to refine stratigraphy and trap configurations. Finally, at the prospect level, it provides the detailed definition required to de-risk fluid presence and reservoir quality assessment.

Uncertainty is reduced and effort is focused toward areas of low risk and high reward. Where favourable geological factors coincide, Regional screening is translated into confident precisely placement.
How Sweet Spotting Identifies High-Value Opportunities With Precision
Sweet spotting is a multi-scale process. The subsurface system is analysed through different technical lenses, ranging from broad basin evaluations to specific well locations. Each stage requires a distinct set of datasets, iteratively working to reduce uncertainty and validate your petroleum system model.
01 Play level – Defining the regional fairway

At the play level, the focus is regional screening. The aim is to define favourable trends and patterns controlled by tectonics, depositional environments, and basin evolution. Plays are ranked based on their petroleum systems, discoveries, and scalability.
This includes;
- Mapping source rock kitchens and maturity
- Outlining reservoir fairways, and regional seal extent
- Identifying migration pathways.
Sweet spots at this level are often associated with structural highs that have access to favourable, mature source kitchens, with areas of proven reservoir and charge.
02 Lead Level – Refining the target

At the lead stage, the workflow is increasingly constrained by data and refined spatially. Leads represent potential target intervals and trap configurations, but more evidence is needed before they mature into drillable prospects.
Exploration Geoscientists integrate multidisciplinary data such as seismic and well data and seismic attribute analysis. Analysing these data sets allows the identification of areas with enhanced reservoir quality and favourable charge access.
Sweet spots at the lead scale are likely preferential areas of good porosity and permeability or better seal integrity relative to surrounding areas.
03 Prospect Level – Defining the trap
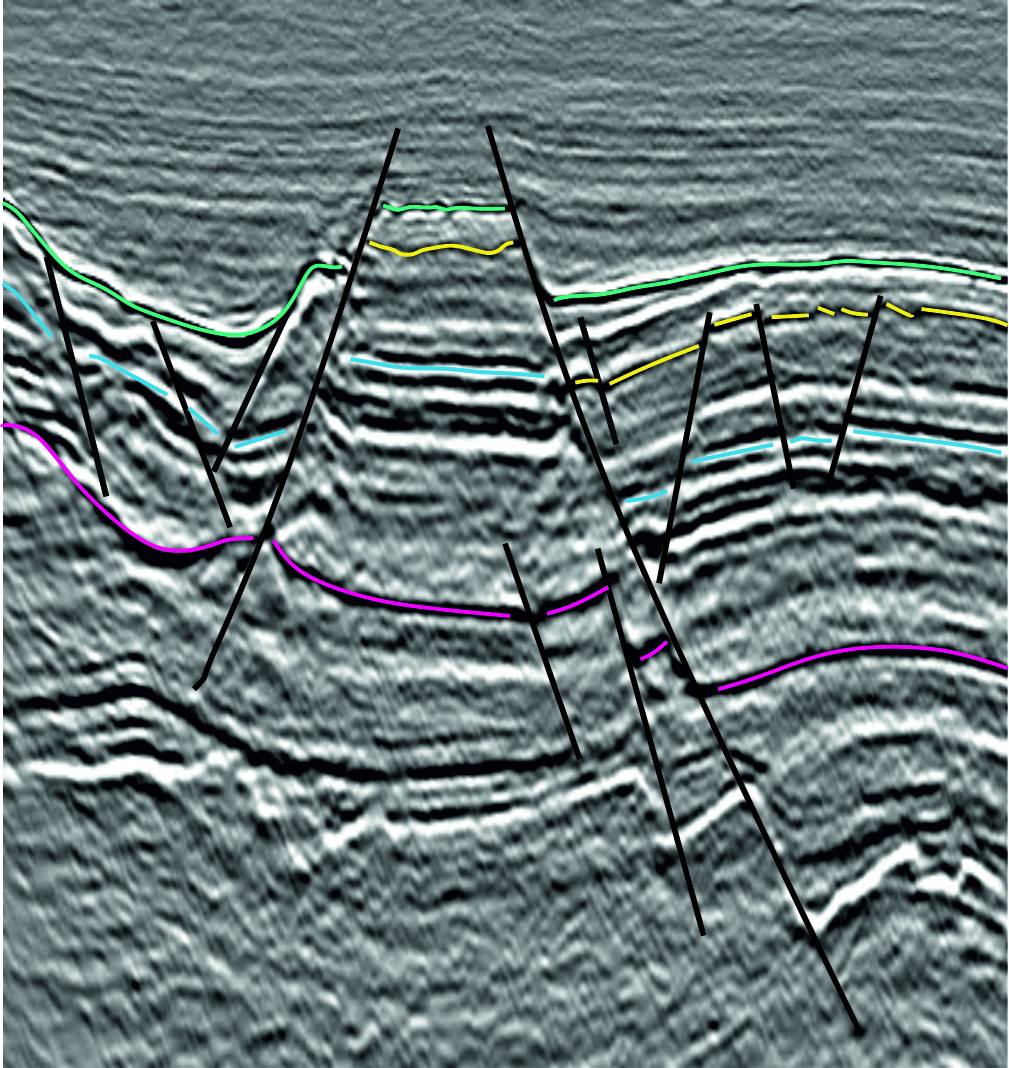
At the prospect level, the focus shifts to detailed trap definition and quantification of associated risk. Pre-drill scenarios can differ significantly in volume outcomes depending on your interpretation of structure, stratigraphy, fluid contacts and reservoir properties.
High-resolution seismic, AVO, inversion, and rock physics are commonly used to de-risk fluid presence and reservoir quality. A well location is ultimately recommended on the basis of the best-supported interpretation and a clearly documented risk assessment. The goal: Prospect risking with reduced uncertainty
Risking is a fundamental element of the sweet spotting process. Each prospect must be evaluated against five key elements: trap, reservoir, seal, charge and timing. Sweet spots represent areas where the risk of these key elements is low and where multiple datasets independently support this. Uncertainty is assessed through rigorous scenario analysis by comparing the targets against well-established analogues and volumetrics.
Sweet spotting cannot eliminate risk entirely, but it does help understand where risk lies and how to manage it through informed decision-making. Integrating multi-scale datasets allows interpretations to be tested and challenged, leading to a more robust understanding of the subsurface., Using robust data as a baseline helps ensure investment decisions remain grounded in geological reality.
Ready to Learn more? Reach out to our Exploration team

Seismic Interpretation
Structural
Geology
Geochemistry
Basin
Modelling
Play Fairway & Prospect Analysis
Petroleum Systems Analysis

Our Exploration team are experts in the integration of subsurface data, including wells and seismic, with geological insights to quantify geological uncertainty and risk. Providing the data to support informed investment decisions to find and evaluate potential energy sources, including fossil fuels and renewable resources.


